- From the point of view of the monthly chart, the price of silver is trending upwards.
- On the weekly chart, XAG/USD remains below its 200-week EMA, sloping down.
- The XAG/USD daily chart shows silver as neutral to down, although a bearish candlestick pattern suggests a leg to the downside is imminent.
Silver prices fell 2.40% during Monday’s North American session, on the back of US dollar strength, despite falling US Treasury yields ahead of the release of the latest FOMC monetary policy minutes. At the time of writing, the XAG/USD pair was forming a bearish candlestick pattern and it was trading at $20.23.
Silver Price Analysis (XAG/USD): Technical Outlook
From a monthly chart perspective, the outlook for white metal looks more positive than negative. July price action formed a dragonfly doji in a crowded area, with the 50-, 100-, and 200-month MAs hovering around the $18.48-$20.17 region, which could pave the way for more gains . On the upside, the 20-month EMA at $23.81 could cap further XAG/USD gains.
Meanwhile, the XAG/USD weekly chart shows the undeclining metal struggling at the 200-week ma at $20.60. Nonetheless, unless sellers push silver below $19.80, buyers could hope for higher prices, although they would face a wall of resistance around $21.48, the 20-week EMA. Once cleared, it would pave the way to the 50-week EMA at $22.73, ahead of the 100-week EMA at $24.11.
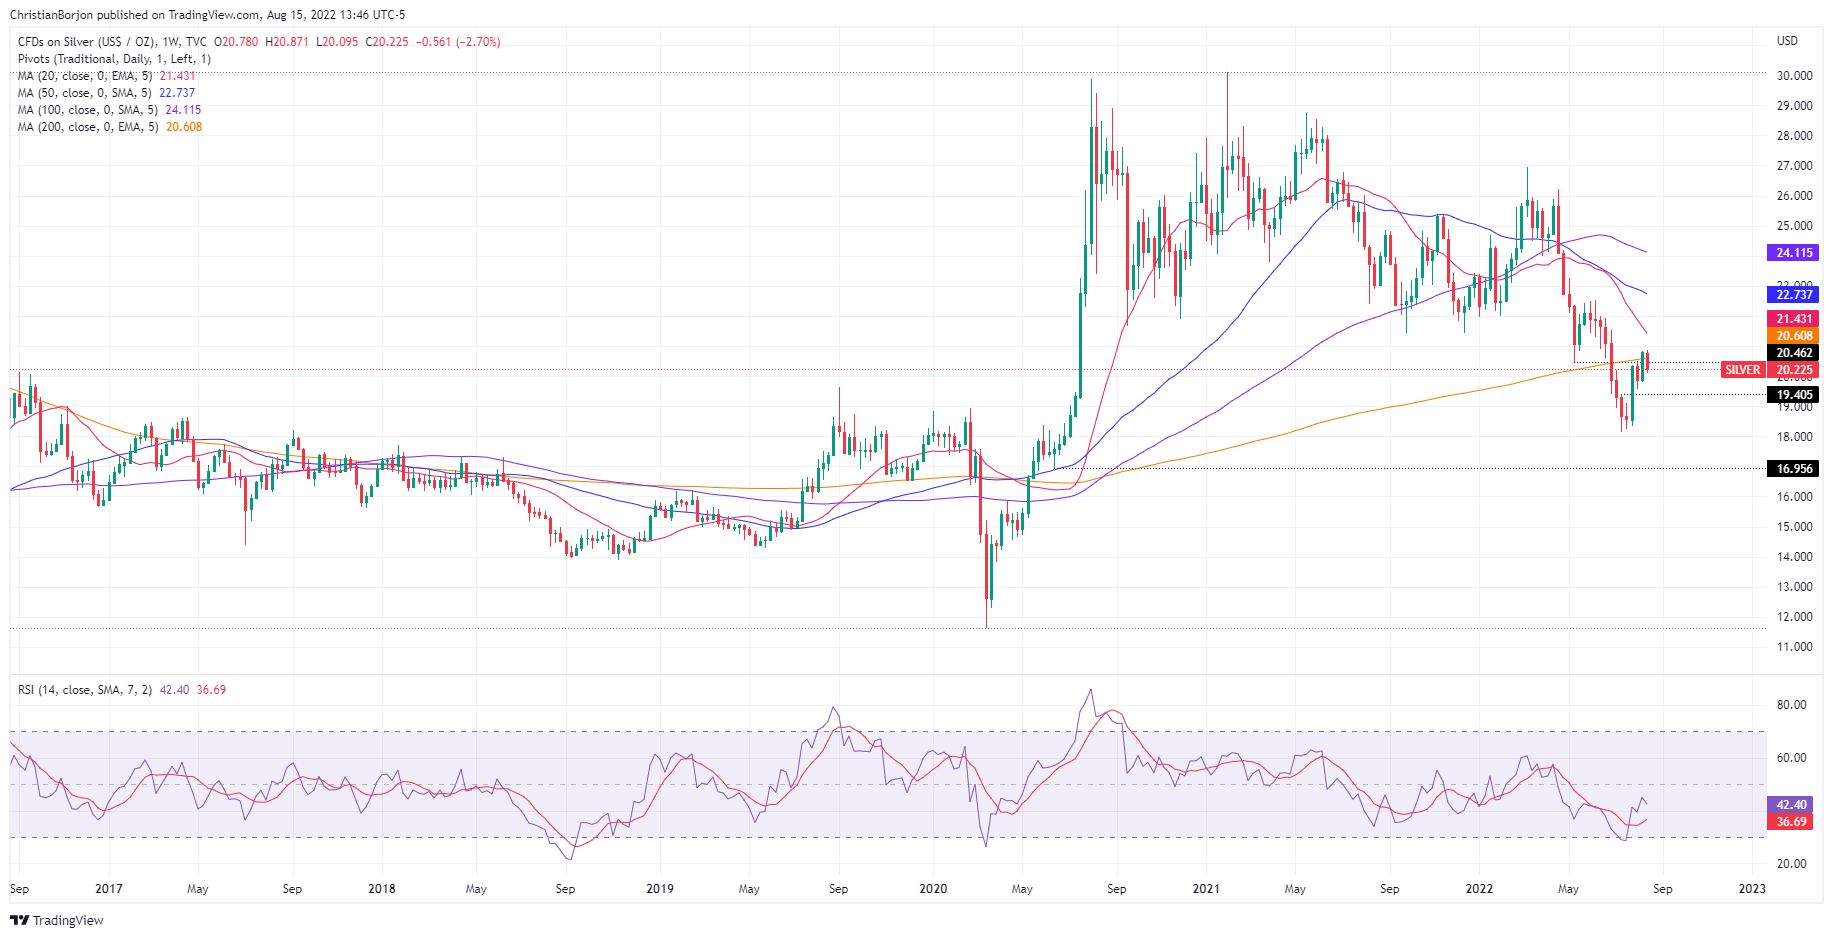 XAG/USD weekly chart
The XAG/USD daily chart shows Silver as neutral to bearish. As mentioned, a bearish engulfing candlestick pattern emerged. Still, the 50-day EMA at $20.18 is a tough support level for sellers to break, but the Relative Strength Index (RSI) targeting down towards the 50 midline could open the door for more losses .
If XAG/USD sellers make a daily close below the above, the next XAG/USD support would be the $20.00 figure which, once cleared, could test the 20-day EMA at $19.73 . On the other hand, if XAG/USD buyers maintain the position above the former, then the first XAG/USD resistance would be the $21.00 figure. A break below will expose key resistance levels like the 50-day EMA at $21.68, followed by the 200-day EMA at $22.68.
 XAG/USD daily chart
Comments are closed.